Research
Two observational paths into the dark matter problem.
My work connects empirical scaling relations, gravitational lensing, and the dynamics of galaxies and clusters. Each is a distinct observational layer; together they provide stringent tests of mass models and gravity.
01A / Scaling relations
BFJR & FP
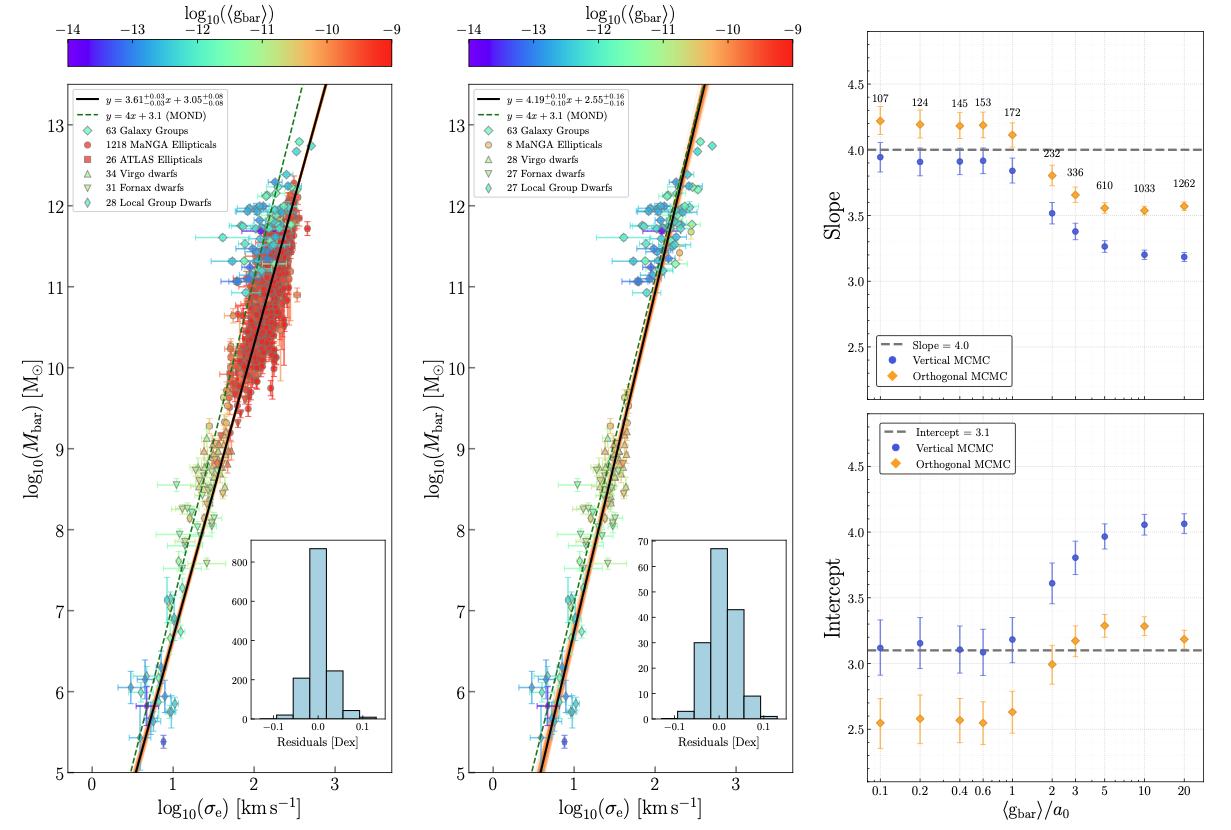
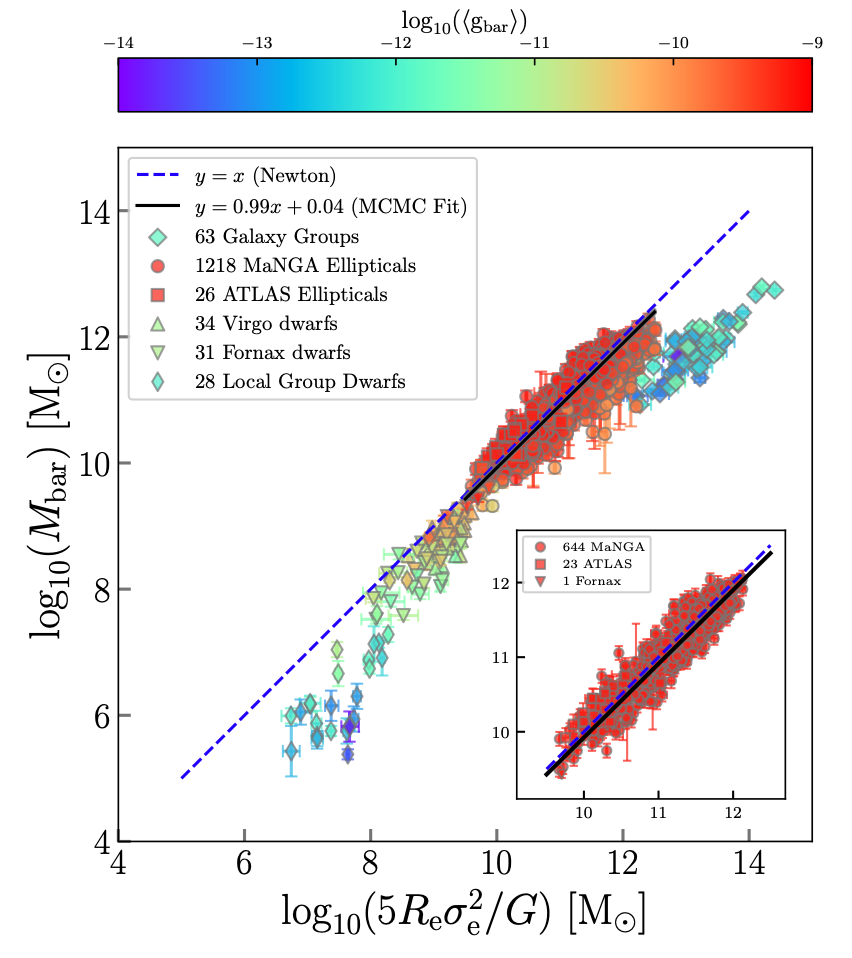
The baryonic Faber–Jackson relation (BFJR) connects baryonic mass with velocity dispersion across pressure-supported systems. For elliptical galaxies, the BFJR is thought to be a projection of the fundamental plane (FP), which includes the stellar half-mass radius as a third variable. Studied together, the two views test which empirical regularities persist from dwarf and elliptical galaxies to galaxy groups.
01B / Scaling relations
BCGs & Galaxy Clusters
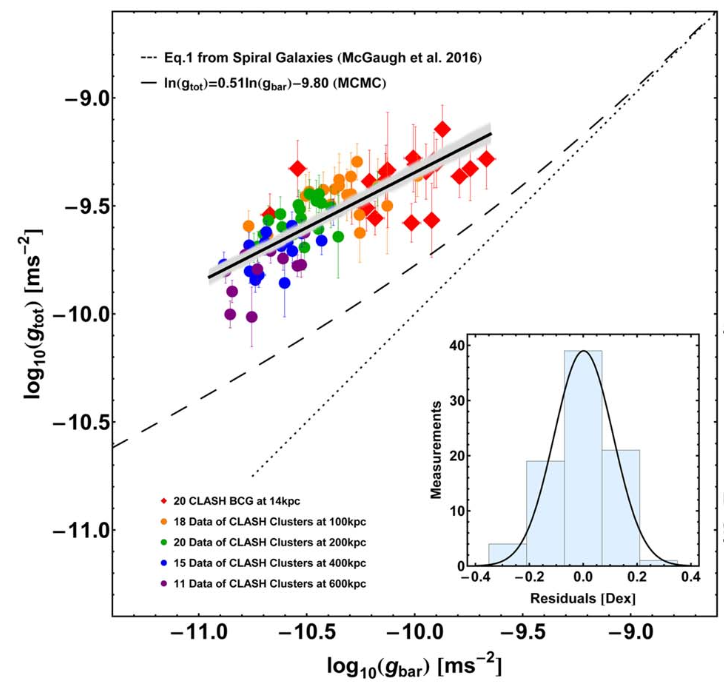
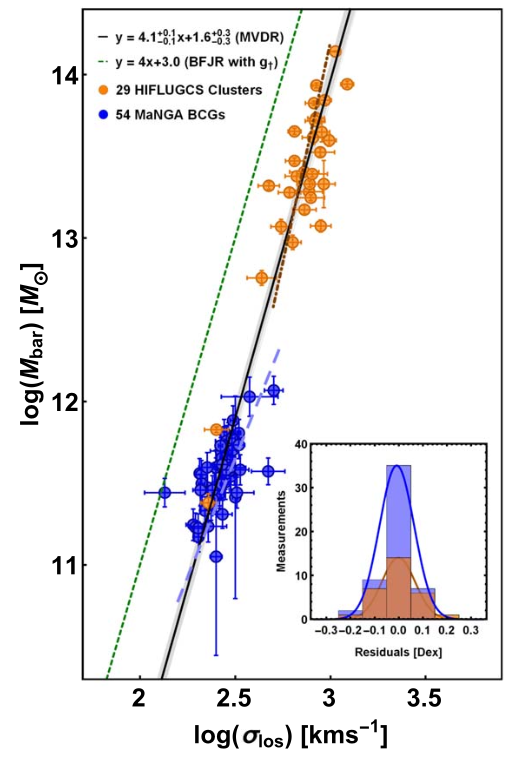
Brightest cluster galaxies and galaxy clusters occupy a distinct dynamical regime. Their radial acceleration relation and mass–velocity dispersion relation provide complementary tests of how baryonic and dynamical quantities scale at the high-mass end.
These relations are presented separately from the BFJR and fundamental-plane results because the samples, measured quantities, characteristic scales, and systematic uncertainties are different.
01C / Research map
Scaling Relations with two possible acceleration scales
This map places the main empirical relations by system and by observational route. It is a guide to how kinematics, dynamics, and lensing connect across scales—not a claim that every entry has the same evidential status.
| System | Kinematics | Dynamics | Lensing | Scales |
|---|---|---|---|---|
| Solar System | Kepler's laws | Newtonian dynamics | General relativity | — |
| Spiral galaxies | g† | |||
| Elliptical galaxies | BFJRSanders (2010)Tian et al. (2026)YT · First author | RARTian & Ko (2019)YT · First authorBrouwer et al. (2021) | g† | |
| Brightest cluster galaxies | MVDRTian et al. (2021b)YT · First author | Cluster RARTian et al. (2024)YT · First author | Cluster RARTian et al. (2020)YT · First author | g‡ |
| Galaxy groups | BFJRSadhu & Tian (2024)YT · Co-authorTian et al. (2026)YT · First author | Open question | Open question | g† |
| Galaxy clusters | MVDRTian et al. (2021a)YT · First author | Cluster RARTian et al. (2020)YT · First author | g‡ |
g† ≈ 1.2 × 10⁻¹⁰ m s−2; g‡ ≈ 2.0 × 10⁻⁹ m s−2.
02 / Lensing & time delay
Lensing & Time Delay
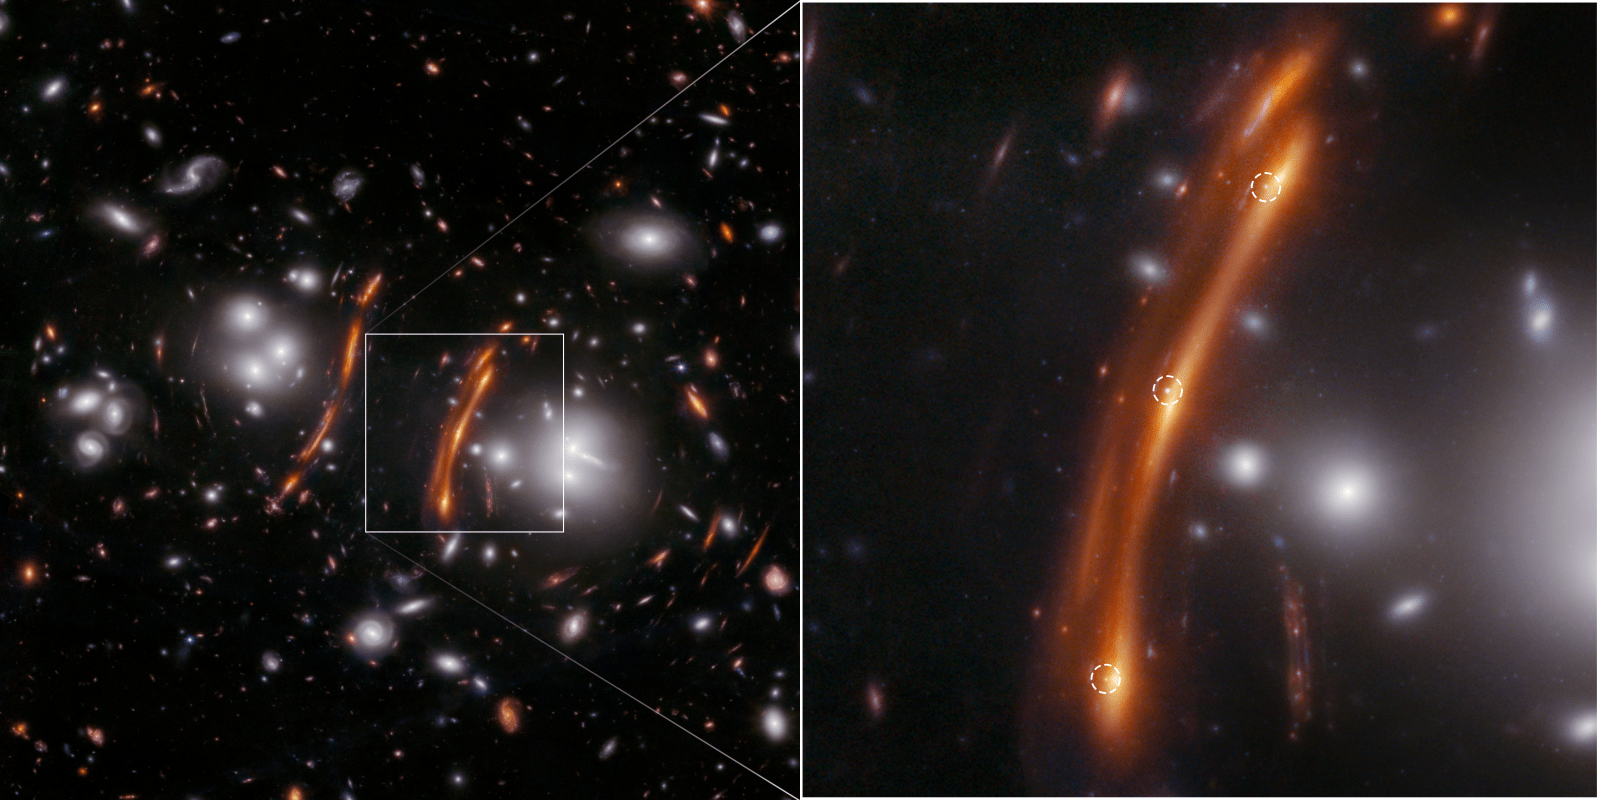
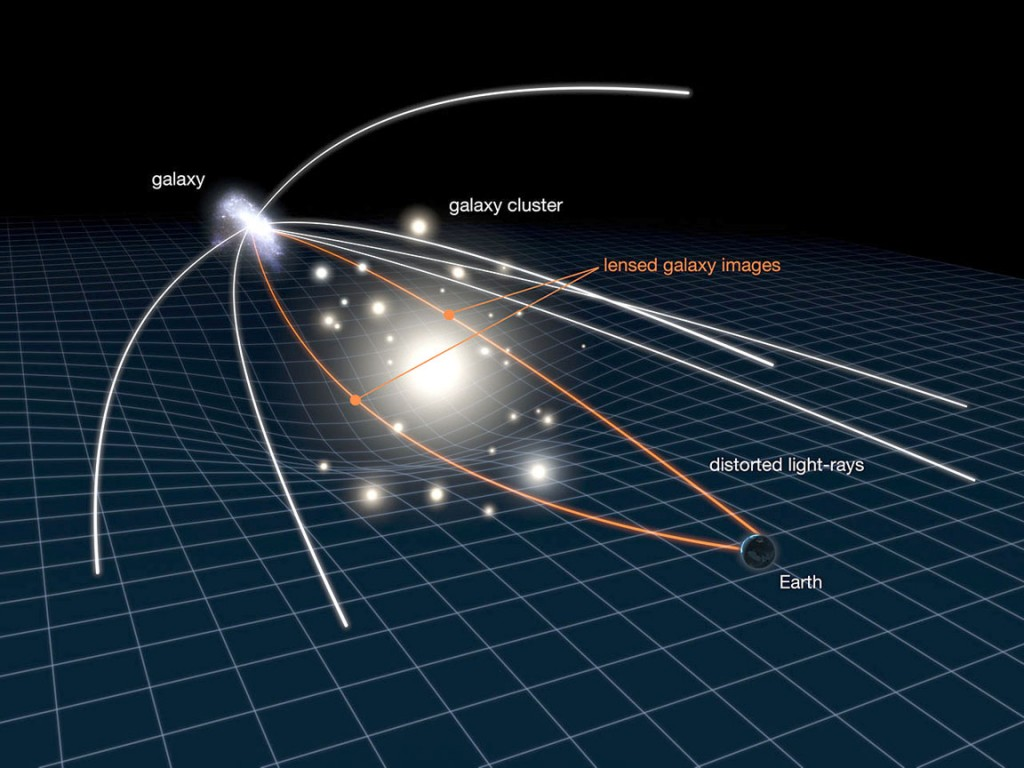
Gravitational lensing offers an independent route to the mass distribution around galaxies. My work uses Einstein rings, strong-lensing mass estimates, and time-delay phenomena to test how lensing constraints connect with dynamical acceleration relations. Current work also examines Shapiro time delay in relativistic modified-gravity frameworks, while keeping observable constraints distinct from theoretical interpretation.
SN H0pe is an observational example of the time-delay method, not a result from my own programme. It is included to make the measurable phenomenon concrete.
Research principle
“A successful fit is a starting point—not yet a physical explanation.”